
Schematic Visualization & Treasure Mapping
Capturing your development on living whiteboards
This is the hero image
schematic-visualization-hero-light-mode.v.2.jpg / schematic-visualization-hero-dark-mode.v.6.jpg
See what is going on while you discuss it
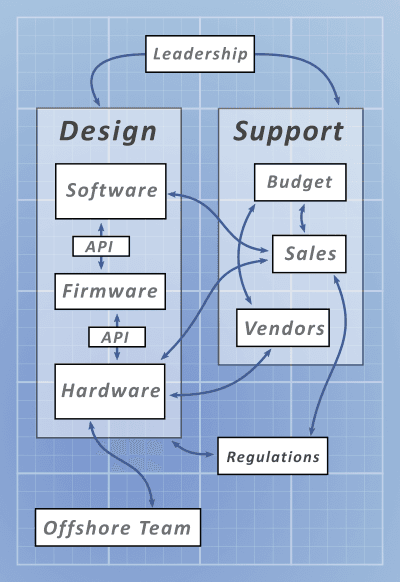
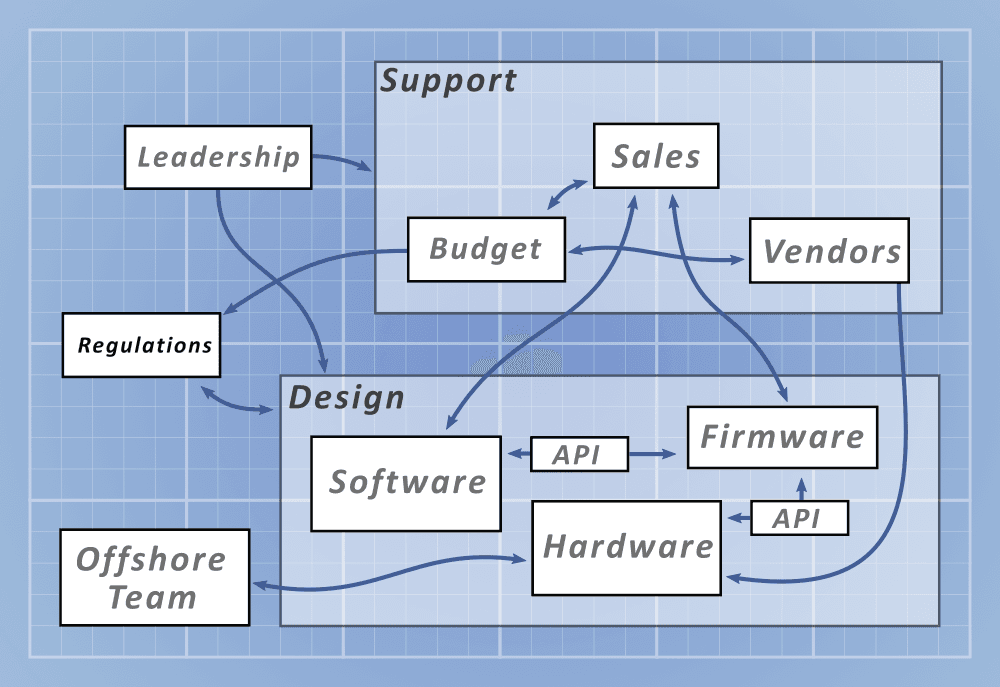
Schematic visualizations show disparate categories of information on a single page that are normally dispersed across a range of information sources. Contemporary design projects are growing increasingly complex and teams are now stretching themselves to ever increasing levels of efficiency and productivity. Having just the right information displayed to the correct decisionmakers (with minimal noise distraction) is more important now than ever before. Schematic visualizations are a way to consolidate & distill information for decisionmakers and share nuanced details with design partners so that everyone can access information they need and ignore what they don't.
Section-1 Image-1
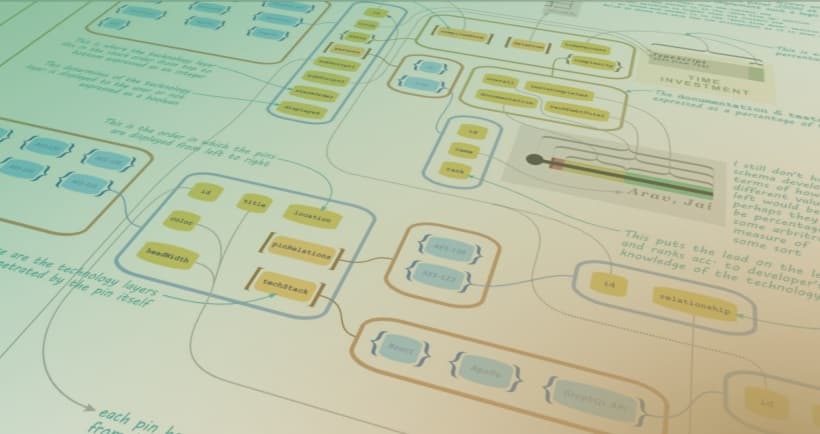
schematic-visualization-executive-dashboard.1.jpg
Ruby on Rails Illustrated
This image belowon the right captures the essence of how a Ruby on Rails project is architected, along with various bespoke layers & elements. In the era before AI, these would be used to document a codebase and even design & debug new features.
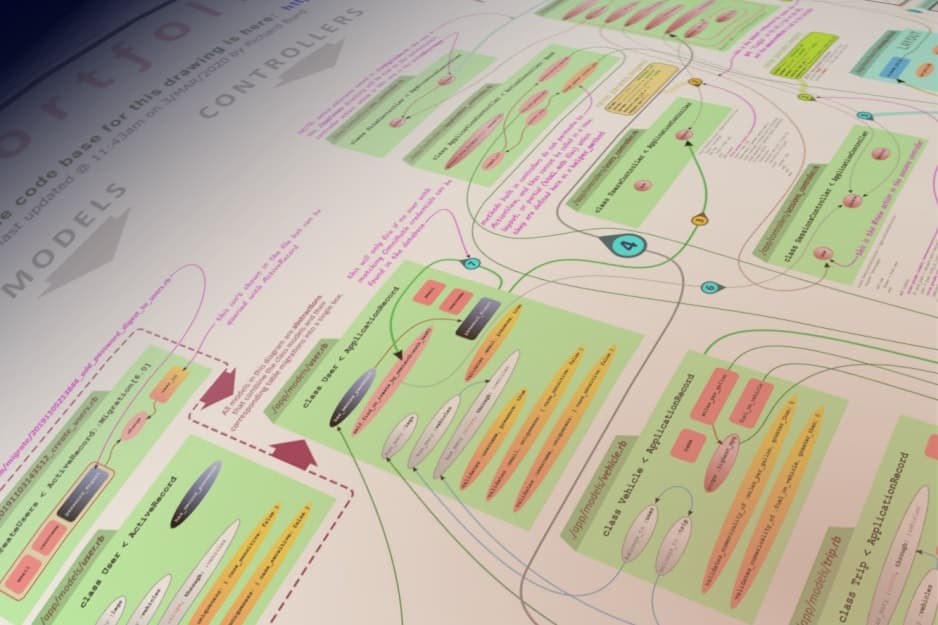
Frontier AI models can view, and interpret, detailed schematic drawings
Most people rely on written language to communicate with AI, but this limits our ability to express complex ideas. Schematic visualizations let us communicate more information in a shorter period of time, and with fewer mistakes in the AI responses. Almost all frontend graphics on this website were built with images fed to an AI agent. A full stack application would be built with high-level architectural diagrams that would then get fed to an AI agent as well. More complex, bespoke code would require more detail, especially if it is something the AI hasn’t ‘seen before’ in its training data.
Light-Dark Mode Toggle Animation
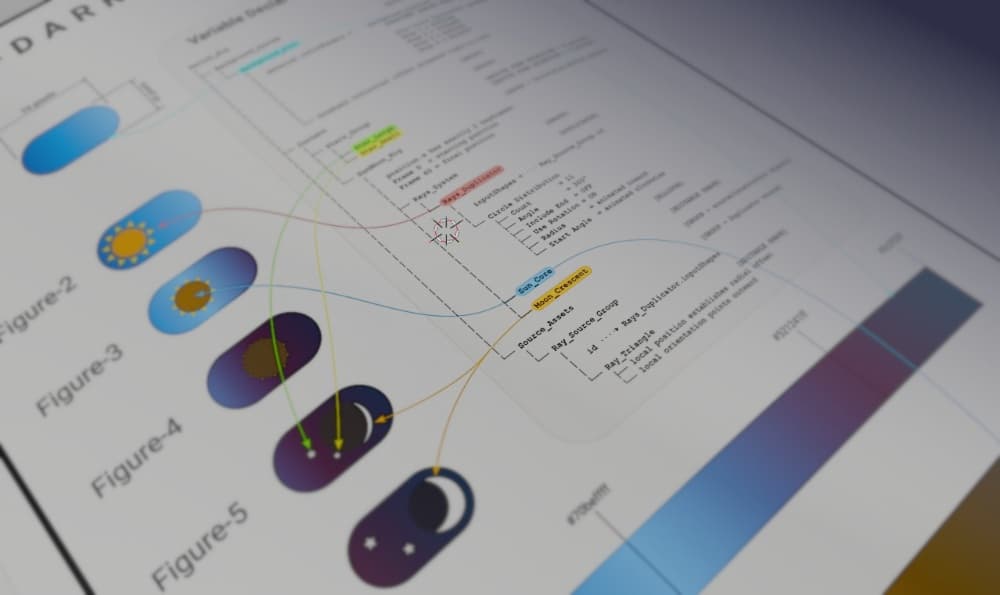
This image belowon the right features several ‘Figures’ built with a simple SVG editor and an accompanying superprompt. The superprompt defines the hierarchy, Variable_Names, and component organization. The AI then spits out a script to generate the animation in Cavalry, a 2D animation program for creating Lottie files for websites. The result was a near complete animation, architected according to Cavalry best practices.
Building consensus around diagrams instead of meetings
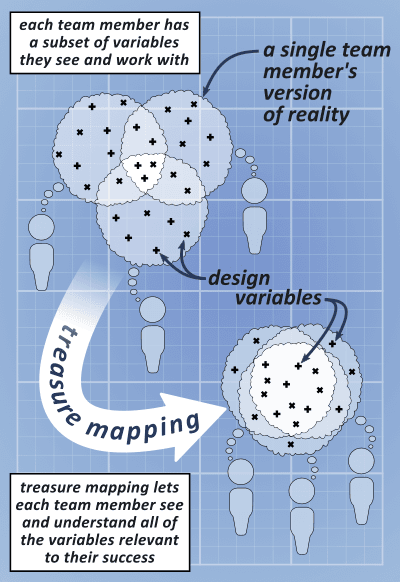
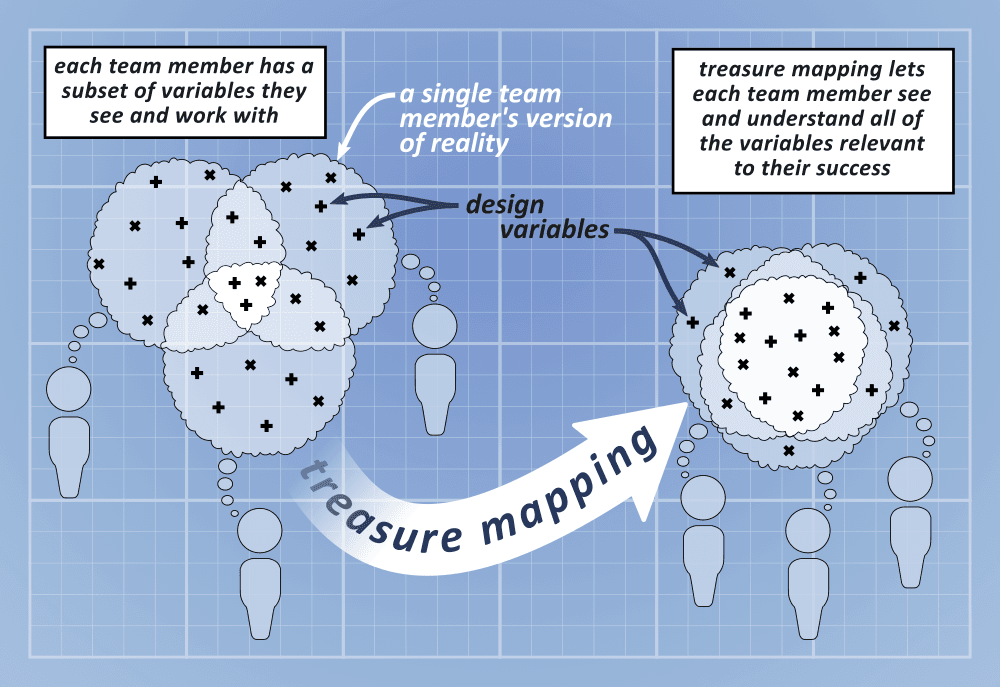
Treasure mapping is a process of using schematic visualizations to guide design projects. The treasure-mapper interviews the design team members individually and discovers pain points between them and other forces acting outside the team. The treasure-mapper then schematically visualizes these pain points into illustrations that can be used to develop solutions that are in turn also rendered schematically so that everyone can see (and build consensus around) the solution that is being proposed. The process is iterative and the treasure map becomes a ground-zero starting point for discussing the design project.
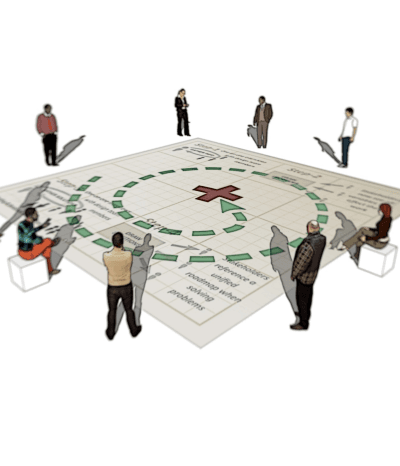
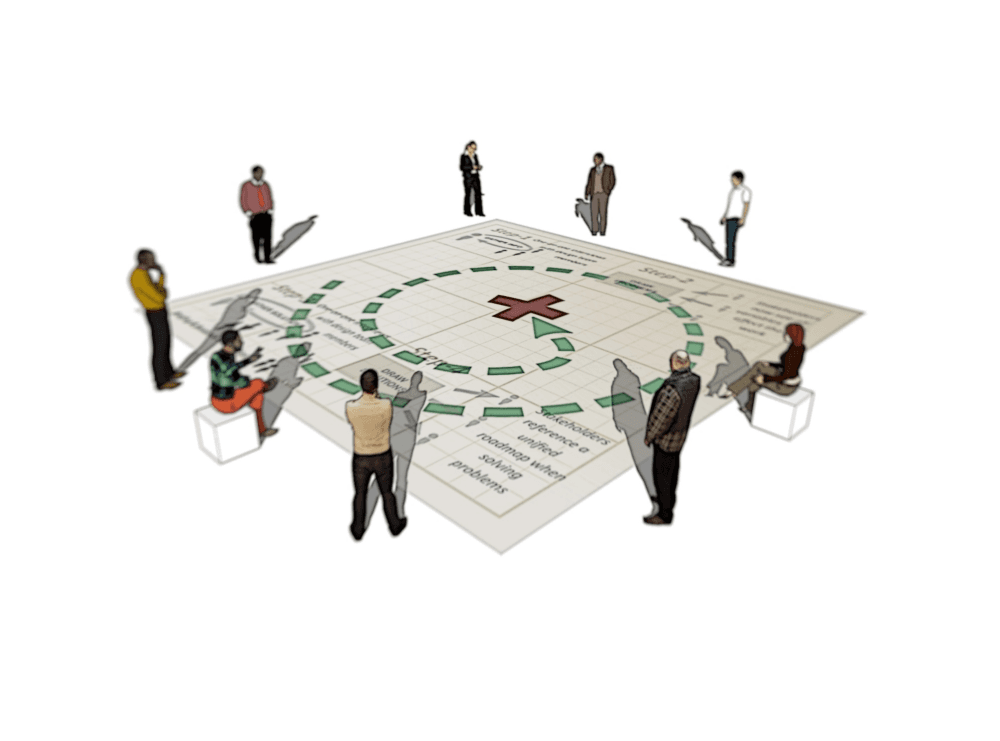
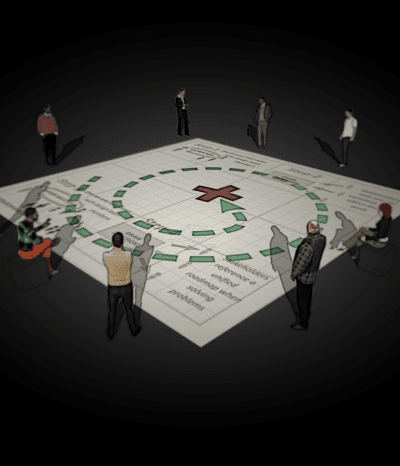

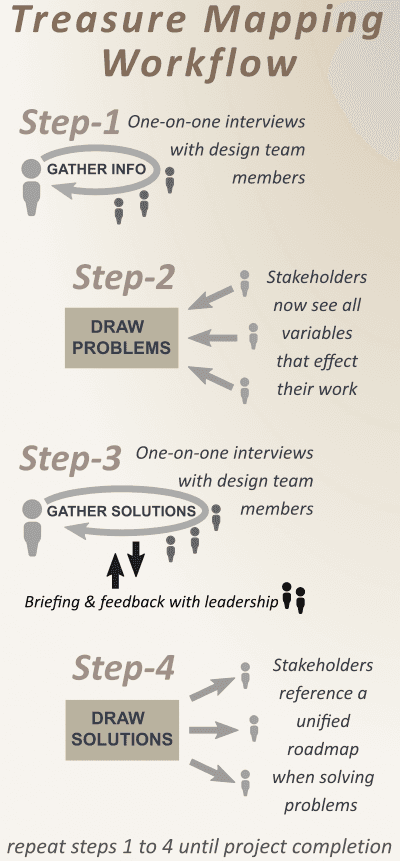
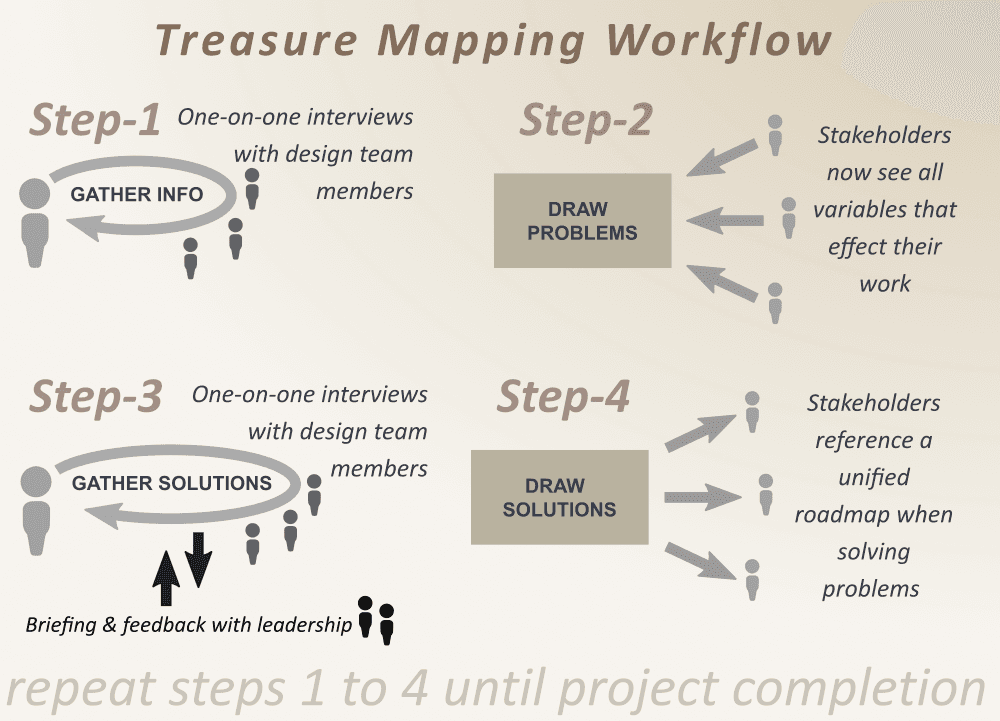
Meetings are unproductive because people get bored and think the person talking is just wasting time. Your design team members may even be incentivized to just shut up in order to end the meeting early, or to avoid being shamed for disagreeing with more senior staff. When your meetings are replaced with treasure mapping, every team member gets one on one attention and their concerns are not only heard, but rendered and mapped to relevant variables decisionmakers can see and understand. This lets decisionmakers weigh input without the interference of social dynamics.
Understand your design and who does what
At some point, your data metrics fail to capture key information related to your design project such as where and why there are disagreements and communication breakdowns within your team. You need to know all of the relevant variables before you make a decision.
Show everyone on the team everything they need to know
Treasure mapping uses schematic visualizations to show your individual team members information they are currently unaware of, but should be in order for them to be successful. In simplest terms, they show all of the relevant variables, to all of the relevant stakeholders.